

What if your financial reports could warn you about trouble before it shows up in the bank account?
A financial dashboard is a single screen that pulls your revenue, expenses, cash flow, and key KPIs into clear charts and scorecards.
No more digging through spreadsheets or waiting for monthly PDFs.
This post shows how dashboards give real-time visibility, let you spot trends and aging receivables, and help you make faster, smarter decisions about cash and growth.
If you want fewer surprises and better control of your money, read on.
Defining the Function and Value of a Financial Dashboard

A financial dashboard is a single screen that pulls together your most important numbers—revenue, expenses, cash flow, profit—and shows them using charts, scorecards, and tables connected to your actual accounting data. You’re not digging through spreadsheets or comparing three different reports. Everything’s right there. Line graphs show you what’s trending up or down, bar charts let you compare this month to last quarter, and color-coded flags tell you when something’s off track.
At its core, a good dashboard needs a few basic pieces:
- KPI scorecards showing actual versus target, usually with green/yellow/red alerts
- Trend charts that track performance over weeks, months, or a rolling year
- Comparison charts stacking current versus prior period or budget side by side
- Aging tables breaking receivables or payables into 30/60/90-day buckets
- Interactive filters so you can slice by time, department, product, or location
The whole point is faster decisions. You’re monitoring what’s happening right now, spotting patterns before they become problems, and drilling into the details when a number moves outside your comfort zone. A solid dashboard shows five to twelve KPIs on the main view, refreshes daily or in real time, and connects straight to your accounting system so you’re not copying numbers by hand.
Advanced Capabilities in Modern Financial Dashboards

Modern dashboards do more than sit there looking pretty. They refresh automatically—sometimes every hour, sometimes every day—pulling live numbers from your ERP, bank feeds, or CRM without you lifting a finger. You can customize what each person sees based on their role. A CFO might want cash forecasting and variance breakdowns, while an operations manager cares more about expense categories and headcount.
Multi-entity dashboards roll up figures from different subsidiaries or divisions, handle intercompany eliminations, and show both consolidated KPIs and individual entity details. Integration-driven automation takes things further. Set up API connections that trigger alerts when a metric crosses a threshold. Accounts receivable aging over 60 days? You get an email. Burn rate spikes above target? The system flags it before your next board meeting.
Interactive controls let you toggle between monthly, quarterly, or trailing-twelve-month views, compare budget scenarios, and drill from a summary scorecard down to the individual transactions behind the number.
- Scenario modeling lets you tweak assumptions—price increase, headcount change—and instantly see the impact on cash and profit
- Anomaly detection flags weird patterns, like a sudden margin drop or a one-off expense spike
- Role-based permissions hide sensitive data from people who don’t need it
- Self-service ad hoc analysis so team members can build their own views or export detail without waiting on finance
- Version control and audit trails track changes to metric definitions and data sources
- Export and collaboration features for sharing snapshots, scheduling automated PDFs, or embedding dashboard links in Slack
Essential Financial KPIs Displayed on a Financial Dashboard
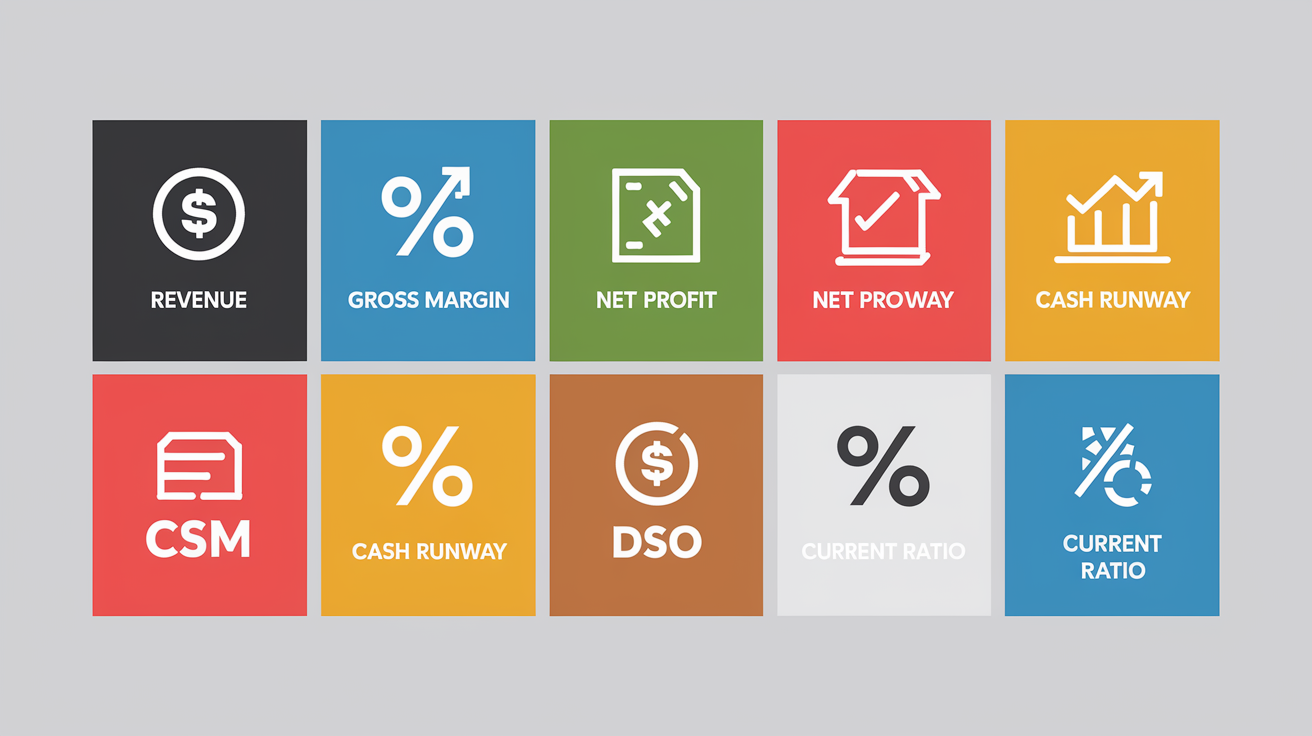
Revenue and expense metrics sit at the top of almost every dashboard. Total revenue shows up as a month-by-month trend, usually alongside growth rate and budget variance. Subscription businesses focus on monthly recurring revenue (MRR) or annual recurring revenue (ARR), breaking out new bookings, expansion, and churn. Expenses get grouped by category: cost of goods sold, payroll, marketing, general and administrative. You see both absolute dollars and percentage of revenue, so you know if spending’s growing faster than income.
Profitability and margin indicators answer “Are we making money?” Gross margin is (Revenue minus COGS) divided by Revenue, shown as a percentage. Most industries run 30 to 70 percent. Net profit margin tells you what’s left after all operating expenses, typically targeting 5 to 20 percent in mature businesses. EBITDA strips out non-cash charges and financing costs, giving a clearer picture of operating performance. For example, “Our EBITDA margin held at 18% even as we scaled headcount.”
Liquidity, cash flow, AR/AP, and operational KPIs finish the picture. Cash balance and cash runway (months of operating expenses covered by current cash) tell you how long you can run before needing more funding. Startups usually aim for 6 to 12 months. Accounts receivable aging buckets (0 to 30 days, 31 to 60, 61 to 90 plus) and days sales outstanding (DSO, typically 30 to 90 days) show how fast customers pay. Days payable outstanding (DPO) tracks how quickly you pay vendors. Current ratio (current assets divided by current liabilities) and quick ratio measure short-term liquidity. A current ratio of 1.5 to 3.0 is common for healthy businesses. Burn rate (monthly net cash outflow) and cash flow from operations, investing, and financing link the income statement to actual cash movement.
| KPI | What it Measures |
|---|---|
| Revenue (MRR / ARR) | Total income or recurring subscription revenue over a period |
| Gross Margin % | (Revenue – COGS) ÷ Revenue; shows product or service profitability |
| Net Profit Margin % | Net income ÷ Revenue; overall profitability after all expenses |
| EBITDA / EBITDA Margin | Operating earnings before interest, taxes, depreciation, amortization |
| Cash Balance & Runway (months) | Cash on hand and months of expenses covered by current cash |
| Days Sales Outstanding (DSO) | Average days to collect receivables; typical range 30–90 days |
| Current Ratio | Current assets ÷ current liabilities; measures short-term liquidity |
| Burn Rate (monthly) | Net cash outflow per month; used to calculate runway |
Visualizing Core Financial Statements Through Dashboards
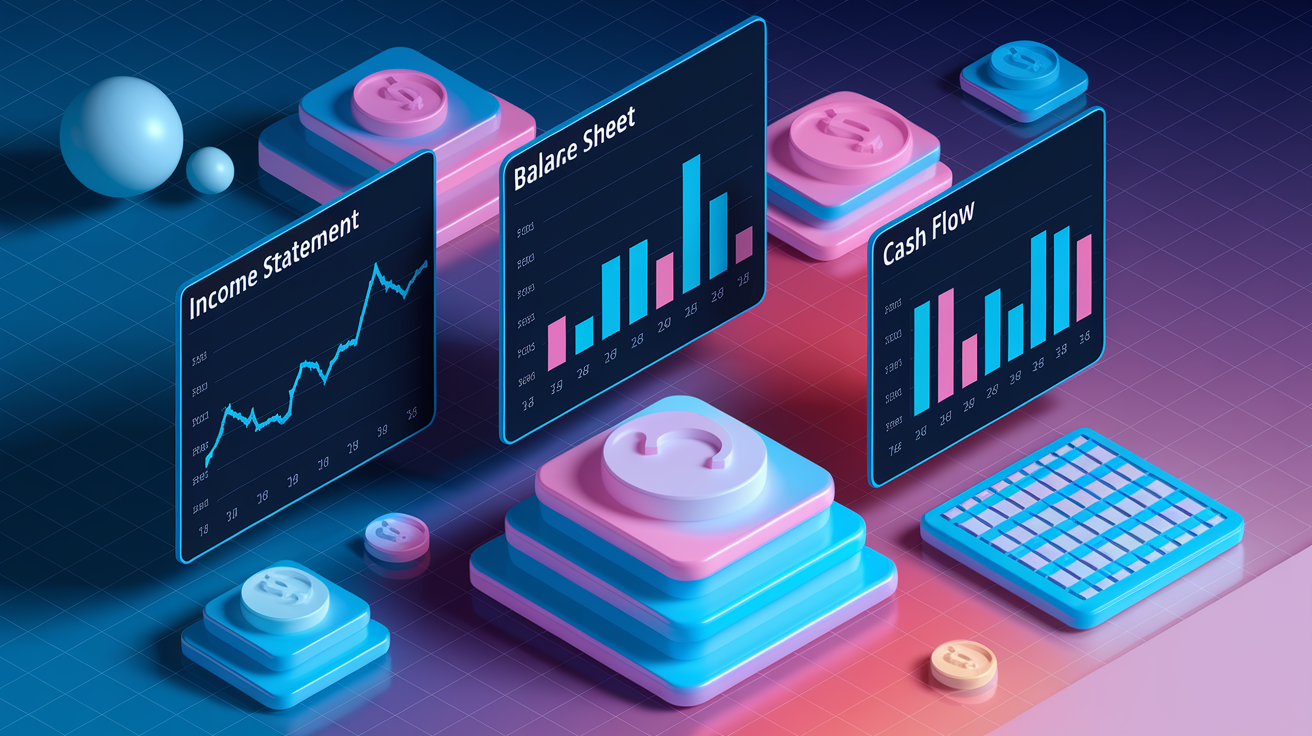
Dashboards turn the three core financial statements (income statement, balance sheet, cash flow statement) into interactive views that update automatically and highlight what’s moving. The income statement becomes a series of trend lines tracking revenue, cost of goods sold, operating expenses, and net income across months or quarters. Instead of reading a static PDF, you’re looking at a line chart showing revenue climbing while gross margin holds steady, or a bar chart comparing this quarter’s expenses to the same quarter last year. Variance heatmaps use color to flag where actual results miss budget, pulling your eye to the line items that need attention. “Marketing spend ran 15% over budget in Q2.”
Balance sheet indicators appear as point-in-time snapshots and ratio scorecards. A dashboard might show total assets, total liabilities, and equity as stacked bars, with a separate panel displaying current ratio and quick ratio. Liquidity gauges turn these ratios into visual dials, making it obvious when working capital dips below safe levels. Cash flow reporting breaks operating, investing, and financing cash flows into separate trend lines, often overlaid on a single chart so you can see whether operating cash is growing even as the company invests in equipment or pays down debt.
Most dashboards offer multiple time windows (current period, prior period, year-to-date, rolling 12-month) so you can toggle between short-term snapshots and longer patterns. Common visualization methods:
- Trend lines tracking monthly or quarterly revenue, profit, and cash balance over 12 or 24 months
- Variance heatmaps with color-coded tables showing budget versus actual by account or department
- Composition charts (pie, treemap) breaking total expenses or revenue into categories or product lines
- Drilldown tables where you click a summary KPI to see the underlying transactions, invoice numbers, or journal entries
Financial Dashboard Use Cases for Different Roles

Executives use dashboards for high-level snapshot reviews. A CEO typically looks at a single-page summary with 8 to 12 KPIs: total revenue, growth rate, gross margin, net profit, cash balance, runway, and one or two strategic metrics like customer acquisition cost or headcount. The goal is a monthly pulse check answering “Are we on track?” without needing deep accounting knowledge. Color-coded thresholds flag metrics falling outside expected ranges, prompting follow-up. “Why did gross margin drop two points this month?” Maybe a supplier increased prices and you haven’t passed the cost to customers yet.
Finance teams (CFOs, controllers, FP&A analysts) use dashboards for forecasting, variance analysis, and monthly close reconciliation. A CFO might spend time in the cash forecasting module, adjusting assumptions about collections and upcoming expenses to model a 13-week cash projection. Controllers rely on accounts receivable and payable aging tables to prioritize collection calls and vendor payments, keeping liquidity healthy. FP&A analysts build rolling forecasts and scenario models, testing what happens if revenue growth slows by five points or the company delays a planned hire. The dashboard recalculates profitability, burn rate, and runway in real time.
Small businesses prioritize operational simplicity and immediate visibility. A small retail shop might track daily sales, cost of goods sold, and cash on hand, with weekly views of payroll and rent due dates. A services firm monitors billable hours, accounts receivable aging, and project-level profitability. Either way, the dashboard replaces manual spreadsheet updates and gives the owner a live view of whether the business is generating enough cash to cover next month’s bills.
- CEO focus includes top-line revenue, profitability, cash runway, strategic KPIs (CAC, churn, headcount)
- CFO / Controller focus covers detailed variance analysis, AR/AP aging, liquidity ratios, monthly close reconciliation
- Small business owner focus centers on daily sales, upcoming bills, cash balance, simple expense breakdown
Data Sources and Integration Architecture Behind Financial Dashboards

Financial dashboards pull data from multiple systems to create a unified view. The most common sources are accounting platforms (QuickBooks, Xero, NetSuite, or a full ERP) supplying general ledger balances, invoices, bills, and journal entries. Bank feeds deliver real-time or daily cash balances and cleared transactions. Customer relationship management (CRM) tools like Salesforce or HubSpot contribute sales pipeline data, closed deals, and customer lifetime value. Payroll systems add headcount, salary expenses, and benefits costs. Marketing platforms feed in campaign spend and cost per acquisition. Some dashboards also import inventory or point-of-sale data to track cost of goods sold and product-level margins.
The data pipeline typically follows an extract, transform, and load (ETL) process. Data gets extracted from each source system via API connections, CSV exports, or database queries. Transformation rules clean and standardize the data. For example, mapping revenue line items from different subsidiaries into a single “Total Revenue” field, or converting foreign-currency figures to home currency using daily exchange rates. The transformed data loads into a data warehouse (Snowflake, Amazon Redshift) or a lightweight dataset layer within the dashboard tool itself. A business intelligence platform (Power BI, Tableau, Looker) then queries this dataset and renders the visualizations you see on screen. Scheduled refreshes (hourly, daily, or after each accounting close) keep the dashboard current without manual uploads.
The ETL workflow in four steps:
- Extract raw data from accounting, CRM, bank feeds, payroll, and operational systems via API or file export.
- Transform by applying business rules to clean, map, and consolidate data (currency conversion, category grouping, intercompany eliminations).
- Load the transformed data into a data warehouse or the BI tool’s internal dataset layer.
- Visualize and refresh as the dashboard queries the dataset on a scheduled cadence (real-time, hourly, daily) and updates charts, scorecards, and tables automatically.
Data lineage documentation tracks which source feeds each KPI, making it easier to troubleshoot discrepancies and maintain accuracy.
Choosing Tools and Software for Building a Financial Dashboard
Excel and Google Sheets remain popular for quick, low-cost dashboards. You can build a simple layout with pivot tables, formulas, and conditional formatting in a few days, especially if your data lives in CSVs or a straightforward accounting export. Sheets work well for small teams that need flexibility and don’t mind manual refresh steps. The downside? Limited scalability. Large datasets slow down, version control gets messy, and sharing live updates requires cloud workarounds.
Business intelligence platforms like Power BI, Tableau, and Looker offer more robust modeling, automated refresh, and multi-user collaboration. Power BI integrates tightly with Microsoft 365 and supports drag-and-drop report building plus custom DAX formulas for complex calculations. Tableau excels at interactive visualizations and handles large datasets smoothly. Looker (part of Google Cloud) provides SQL-based modeling and strong governance features. These tools typically take 4 to 12 weeks to deploy for an enterprise dashboard, but the result is a scalable system that refreshes on schedule and supports role-based access. Many accounting systems (QuickBooks Online, Xero, NetSuite) also include embedded dashboards or reporting modules, which can be a fast starting point if your needs are straightforward.
| Tool | Best Use Case |
|---|---|
| Excel / Google Sheets | Quick prototypes, small teams, simple layouts with manual refresh |
| Power BI | Microsoft-centric organizations, complex calculations, scheduled refresh, wide distribution |
| Tableau | Advanced interactive visualizations, large datasets, multi-source integration |
| Embedded accounting dashboards (QuickBooks, Xero) | Out-of-the-box simplicity for single-entity businesses with standard KPIs |
Best Practices for Designing an Effective Financial Dashboard

Visual hierarchy guides the viewer’s eye to what matters most. Place the highest-priority KPIs (revenue, profit, cash balance) at the top or center, using larger fonts or prominent scorecards. Supporting details and drill-down links sit below or to the side. This layout mirrors how people naturally scan a page, ensuring decision-makers see critical alerts before they scroll. Arrange charts in a logical flow: start with top-line revenue, move to profitability, then liquidity and cash flow, so the story unfolds in the order someone would ask questions during a financial review.
Clarity beats complexity. Limit the main dashboard to 5 to 12 KPIs and use color sparingly. Reserve green, yellow, and red for threshold alerts, not decoration. Too many colors create noise. A simple palette (one or two accent colors plus neutral grays) keeps the focus on the numbers. Choose chart types that match the story you’re telling: line charts show trends over time, bar charts compare categories or periods, and tables display granular detail when someone needs to verify a specific transaction. Avoid pie charts with more than five slices. They’re hard to read, and treemaps or stacked bars usually work better for composition.
Data storytelling turns a static report into a decision tool. Instead of just showing “Revenue: $1.2M,” add context with a small caption or variance label: “Revenue $1.2M, up 8% vs. prior month, 3% below budget.” This prompts the next question (why the budget miss?) and encourages drill-down. Consistent metric definitions are critical. Document what “revenue” includes (gross or net of refunds?), how “cash balance” is calculated (operating accounts only or all accounts?), and make sure everyone on the team uses the same definitions. When metrics shift meaning from month to month, the dashboard loses credibility and people stop trusting the numbers.
Implementation Timeline and Steps for Launching a Financial Dashboard
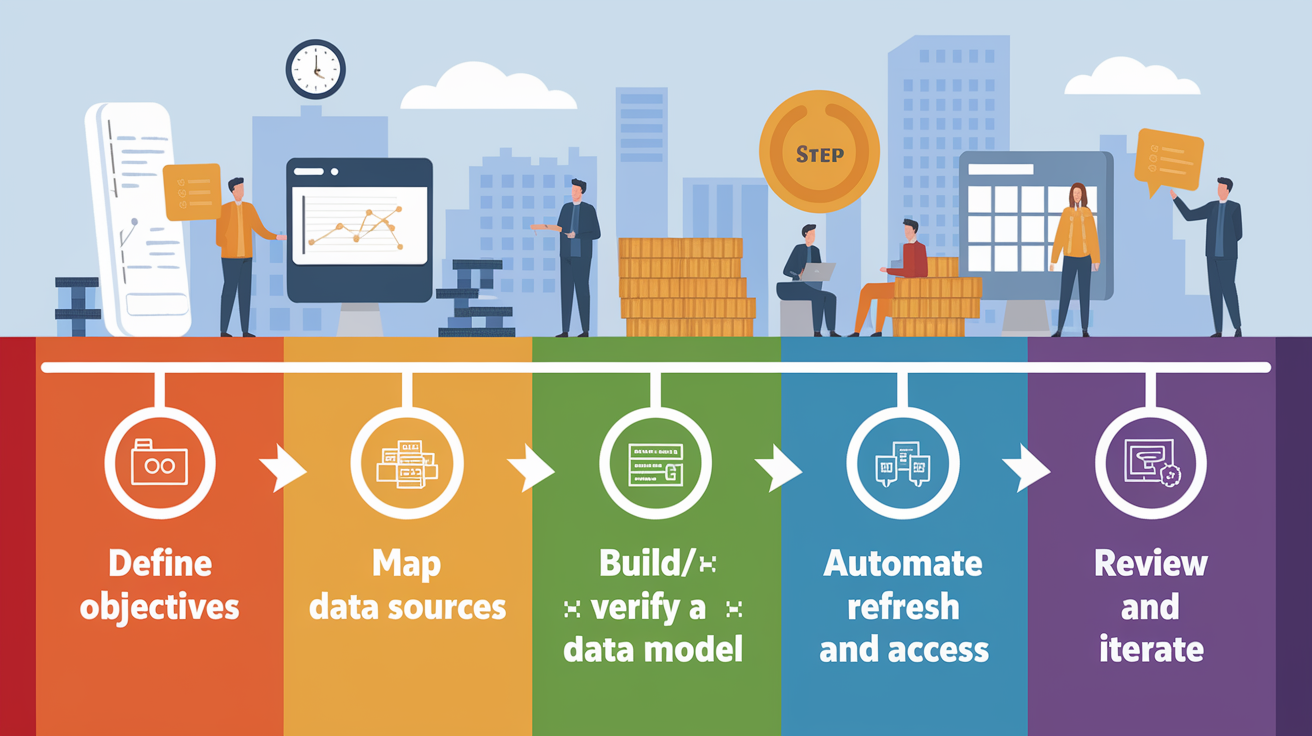
Rolling out a financial dashboard follows six core steps, each building on the last to make sure the final product aligns with business needs and data reality.
-
Define objectives and priority KPIs. Identify the business questions the dashboard must answer (Are we profitable? Can we cover payroll next month? Where are expenses growing fastest?) and select 5 to 12 KPIs that directly inform those decisions.
-
Map data sources and field mappings. List every system that holds relevant data (accounting, CRM, bank, payroll) and document which fields map to each KPI. For example, “Total Revenue” pulls from general ledger account 4000 to 4999; “Cash Balance” comes from the bank feed for account ending in 1234.
-
Build and verify a small data model. Extract a sample dataset, transform it according to your mapping rules, and compare the dashboard’s numbers to a trusted source (last month’s financial statement) to confirm accuracy before automating the full pipeline.
-
Design visuals prioritized by decision value. Create charts and scorecards for the most important KPIs first, then add drill-down tables and supporting views. Test the layout with a few users to make sure it’s intuitive.
-
Automate data refreshes and set access controls. Schedule the ETL pipeline to run daily (or hourly for real-time dashboards), configure role-based permissions so sensitive data stays protected, and set up alerts or threshold notifications to flag metrics that move outside acceptable ranges.
-
Review and iterate monthly or quarterly. Revisit the dashboard after the first full month to catch any data quality issues, adjust KPI definitions if needed, and gather feedback from users. Plan a more formal review each quarter to retire unused metrics and add new ones as priorities shift.
Timelines vary by complexity. A simple Excel or Google Sheets prototype can be ready in one to two weeks, especially if the data already lives in a clean export. A production-grade BI dashboard with multiple data sources, automated refresh, and enterprise security typically takes four to twelve weeks. Startups and small businesses often land somewhere in the middle: two to four weeks for a focused dashboard covering revenue, expenses, cash, and a handful of operational KPIs.
Automation features speed up the ongoing cycle. Once the pipeline’s live, data refreshes happen on schedule without manual uploads. Threshold alerts (an email when accounts receivable over 90 days exceeds $50,000) let you respond to problems early instead of discovering them during the monthly close. Workflow integrations can trigger actions in other systems. When cash runway drops below three months, the dashboard logs a task in your project-management tool to update the fundraising plan.
Governance, Maintenance, and Common Dashboard Mistakes

Ongoing governance keeps the dashboard accurate and relevant as your business evolves. Monthly reconciliations compare dashboard figures to official financial statements, catching any drift caused by data pipeline errors or changes in source-system formats. Quarterly layout reviews assess whether the current KPIs still match leadership priorities. If the company pivoted from growth to profitability, the dashboard should shift emphasis from revenue growth rate to margin and burn rate. Access controls make sure only authorized users see sensitive metrics like individual salaries or detailed P&L by customer, while version control and data lineage documentation track changes to metric definitions and data sources, creating an audit trail that simplifies troubleshooting.
Mistakes often cluster around design and data hygiene. Overcrowding the main screen with 20 or 30 KPIs forces users to hunt for the numbers that matter, diluting the dashboard’s value. Stick to 5 to 12 top metrics and move everything else to drill-down views. Inconsistent definitions confuse teams. If “revenue” sometimes includes pending invoices and sometimes only cash collected, no one trusts the trend line. Irregular data updates create stale dashboards showing last week’s numbers during a fast-moving period, undermining confidence. Ignoring user feedback leads to dashboards that answer questions no one’s asking, while neglecting mobile or low-resolution layouts makes the tool unusable for executives who check KPIs on a phone between meetings.
Five common mistakes to avoid:
- Too many KPIs on one screen. Limit the main view to 5 to 12 metrics; use drill-downs for detail.
- Inconsistent metric definitions. Document and enforce standard calculations so “gross margin” means the same thing every month.
- Infrequent or manual data refreshes. Automate the pipeline and schedule regular updates (daily or hourly) to keep numbers current.
- No reconciliation routine. Compare dashboard totals to official statements monthly to catch errors early.
- Ignoring layout and color accessibility. Test the dashboard on different screens and with colorblind-friendly palettes so everyone can read it clearly.
Final Words
You’ve seen how dashboards turn raw accounting data into visual insights that help spot trends and act faster.
They combine scorecards, charts, tables, filters, and aging views, and support real-time updates, customization, and drilldowns so teams can make decisions without digging through spreadsheets.
If you’re still asking what is a financial dashboard, it’s a single-pane view of the numbers that matter most—designed to monitor performance, catch problems early, and guide better choices. Start small, focus on 5–12 KPIs, and you’ll build something people use and trust.
FAQ
Q: What should a financial dashboard include?
A: A financial dashboard should include 5–12 key KPIs and visuals, including scorecards, trend and comparison charts, breakdown (pie/treemap) views, AR/AP aging tables, cash-flow projections, and filters or drilldowns tied to accounting.
Q: What are the 4 types of dashboards?
A: The four dashboard types are strategic, analytical, operational, and tactical. Strategic gives executives a high-level view, analytical supports deep data exploration, operational tracks daily metrics, and tactical targets short-term projects.
Q: What is the best financial dashboard app?
A: The best financial dashboard app depends on your needs. Use Excel or Google Sheets for quick prototypes, Power BI or Tableau for scalable BI, and accounting-embedded dashboards for real-time feeds and simpler integration.
Q: How can I create my own dashboard?
A: You can create your own dashboard by defining goals and 5–12 KPIs, mapping data sources, choosing a tool (Sheets, Power BI), designing clear visuals, connecting data, automating refreshes, and testing with users.