

Think a healthy profit means you won’t run out of money?
Not necessarily.
Cash flow tracking is the simple habit of recording every dollar that enters and leaves your accounts so you always know how much cash you can actually use today.
It focuses on timing, when money lands or leaves the bank, not just what’s on paper.
This post shows the basic steps to set up tracking, how manual and automated methods differ, and how real-time monitoring helps you spot shortfalls, plan payments, and keep your account from surprising you.
Clear Breakdown of Cash Flow Tracking Basics

Cash flow tracking is just keeping a record of money moving in and out of your accounts. It answers one question: how much cash do you have right now, and where’s it going? Unlike accounting systems that measure profit or revenue on paper, cash flow tracking cares only about the actual dollars hitting your bank account and the dollars leaving. For personal finances, you’re noting paychecks and bills. For businesses, you’re watching customer payments, supplier invoices, payroll, loan payments, and anything else that changes how much cash you can actually access today.
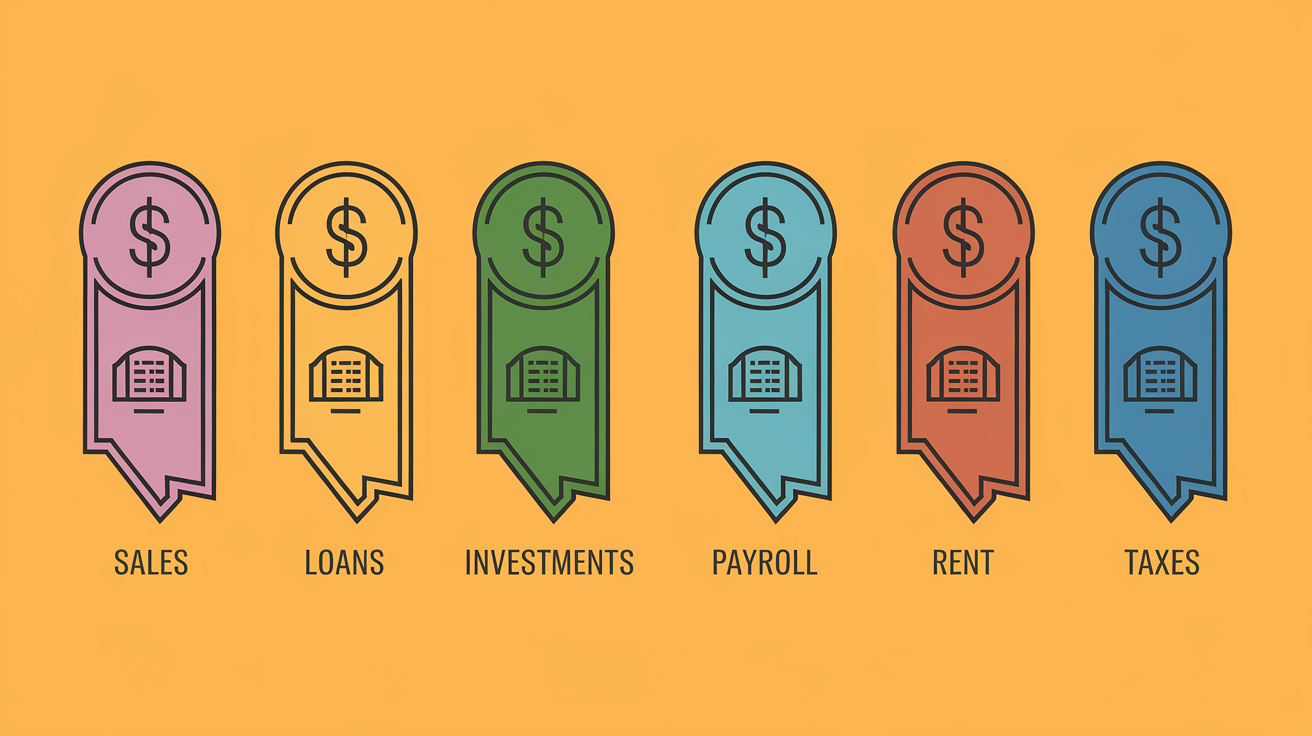
Cash inflows are everything coming in. Sales receipts, loan proceeds, customer payments, investment returns, other sources of real cash. Cash outflows cover what’s going out: rent, payroll, taxes, supplier invoices, loan repayments, equipment purchases. The difference between inflows and outflows over a period shows whether your cash position is growing or shrinking. Tracking both sides reveals patterns, predicts shortfalls, and helps you plan for upcoming expenses before they arrive.
Plenty of people start tracking cash manually with spreadsheets or handwritten logs. You enter each transaction yourself, update your balance, watch the totals shift. Manual tracking can work for very small operations or short-term needs, but it brings higher risk of errors, takes more time, and won’t show changes in real time. More advanced setups pull data automatically from bank feeds or accounting systems, giving you an up-to-date view without manual entry. Either way, the core idea stays the same: watch the cash, understand the timing, never lose sight of what you can actually spend.
How Cash Flow Tracking Works in Practice

The basic workflow starts with gathering transaction data from wherever cash moves. Common sources are bank accounts, credit cards, accounting software, invoicing systems, payroll platforms. Once you’ve got the raw data, you aggregate it into a single view, ideally showing all accounts and entities together if you run a larger operation. From there, you visualize inflows and outflows in charts or tables, run forecasts to predict future balances, and monitor variance between what you expected and what actually happened.
Here’s the typical process:
- Connect data sources. Link bank feeds, ERP systems, invoices, and expense records so transaction data flows into one place.
- Aggregate and consolidate. Combine data from multiple accounts, subsidiaries, or currencies into a unified cash position.
- Visualize inflows and outflows. Use charts, tables, or summary cards to see beginning balance, total inflows, total outflows, and ending balance.
- Run forecasts and scenarios. Predict future cash needs based on historical patterns, upcoming invoices, and expected receipts.
- Monitor variances and alerts. Compare actual results to forecasts and flag unusual swings or low balances.
- Automate workflows and reconciliations. Reduce manual entry and cross-check transactions against bank statements to catch errors early.
Real-time tracking systems update continuously as transactions post, so you always know your current cash position. Manual methods require you to enter data after the fact, which means your view is only as fresh as your last update. If you wait until the end of the week to log transactions, you might miss a low balance warning or an unexpected expense. Automated dashboards can alert you the moment a threshold is crossed, giving you time to move cash, delay a payment, or speed up collections. The faster you see changes, the faster you can respond.
Key Differences Between Cash Flow Tracking and Profit Measurement

Profit and cash flow aren’t the same thing. Profit is an accounting measure (revenue minus expenses on your income statement) that can include non-cash items like depreciation, accrued revenue, or unpaid invoices. Cash flow reflects only the actual movement of money into and out of your accounts. You can show a profit on paper but run out of cash if customers pay late or if you spend more upfront than you collect.
Cash flow tracking focuses on timing. It tells you when you received payment, when you paid the supplier, and how much cash you have available today. Profit measurement tells you whether your business model is fundamentally making money, but it won’t tell you if you can cover payroll next week. Both matter. They just answer different questions.
| Category | What It Means | Key Insight | Example |
|---|---|---|---|
| Cash Flow | Actual money in and out of accounts | Shows liquidity and immediate ability to pay bills | Customer paid $5,000 on Tuesday; you have $5,000 more cash today |
| Profit | Revenue minus expenses (may include non-cash items) | Shows whether your operations are fundamentally profitable | You earned $10,000 revenue last month, but customer hasn’t paid yet; profit is recorded, cash is not |
| Timing | Cash flow reflects when transactions settle; profit reflects when they’re recorded | Profit can be positive while cash is negative if receivables are slow | Invoiced $20,000 in March (profit), received payment in May (cash flow) |
| Non-Cash Items | Profit includes depreciation, accruals, deferred revenue; cash flow does not | You can be profitable on paper with no cash in the bank | $2,000 depreciation lowers profit but doesn’t change your cash balance |
Benefits of Consistent Cash Flow Tracking

Tracking cash flow consistently gives you visibility into your financial health before problems turn into crises. When you know exactly how much cash you have and where it’s going, you can plan ahead, avoid overdrafts, and make smarter decisions about spending, hiring, or investing. Real-time tracking reduces surprises. You see low balances early enough to delay a vendor payment, speed up collections, or tap a credit line before you run dry.
Automated systems cut down on manual errors and save time. Instead of entering transactions by hand and risking formula mistakes or duplicate data, you connect your bank feeds and accounting software directly. Machine learning tools can flag unusual transactions, identify patterns in your cash cycle, and improve forecast accuracy. Some implementations report accuracy above 95 percent. Automation also frees up time for analysis rather than data entry, and studies show forecasting productivity can improve by 70 percent when manual processes get replaced with automated workflows.
Here are five core benefits you gain from consistent cash flow tracking:
Real-time visibility. Know your current cash position at any moment, not just at month-end.
Reduced errors. Automated data imports and validation rules catch duplicates, missing entries, and outliers before they skew your view.
Better forecasting. Historical data and predictive models help you estimate future inflows and outflows with greater confidence.
Faster decision-making. Clear dashboards let you compare actual vs forecast, spot variances, and adjust plans without waiting for reports.
Anomaly detection. Machine learning flags unusual patterns (large unexpected outflows, late payments, or sudden drops) so you can investigate quickly.
Tracking also builds discipline. When you review cash flow weekly, you stay on top of working capital, manage receivables and payables more tightly, and avoid the end-of-month scramble to figure out why the account is empty. It turns cash management from a reactive chore into a proactive routine.
Common Categories Tracked in Cash Flow Monitoring
Most tracking systems organize transactions into income and expense categories so you can see where cash originates and where it goes. The exact categories vary by business or household, but the structure is the same: list all sources of inflows, list all uses of outflows, and track each one over time.
Income categories typically include sales receipts and customer payments (accounts receivable collections), loan proceeds or financing inflows, investment income and dividend receipts, grants, refunds, or rebates, and proceeds from asset sales or lease income.
Expense categories typically include payroll and employee benefits, supplier and vendor payments (accounts payable), rent, utilities, and operating expenses, taxes, loan payments, and interest, plus capital expenditures and equipment purchases.
Timing is everything in cash flow tracking. A customer might owe you $10,000 (that’s an asset on your balance sheet), but until the payment clears your bank account, you can’t use that $10,000 to pay rent. Real-world examples include logging daily or weekly sales deposits as they hit the bank, scheduling upcoming vendor payments so you know what will leave the account next week, tracking payroll runs to avoid shortfalls on payday, and noting scheduled loan payments so you reserve enough cash in advance. Organizing transactions into clear categories and tracking when each one happens eliminates guesswork. You always know what cash you actually have versus what you expect to receive or spend.
Manual vs Automated Cash Flow Tracking Methods

Manual tracking relies on spreadsheets or paper records. You enter each transaction by hand, update formulas, and maintain the log yourself. This approach offers flexibility and low upfront cost. Anyone with Excel or Google Sheets can build a basic cash flow tracker in an afternoon. Manual methods work reasonably well for very small businesses, freelancers, or short-term projects with low transaction volumes. The catch is time and accuracy. Every entry is an opportunity for a typo, a missed line, or a formula error, and you only see updates when you take the time to log them.
Automated tracking connects directly to your data sources. Bank feeds, accounting systems, and payment platforms push transactions into a central dashboard automatically. The system aggregates data, applies validation rules, and updates your cash position in real time or on a schedule you set. Automated dashboards offer features like predictive forecasting, variance alerts, anomaly detection using machine learning, and seamless integration with ERP systems via APIs. Some platforms report 100 percent automated bank integration and anomaly detection accuracy above 95 percent, catching unusual transactions before they cause problems.
| Criteria | Manual | Automated |
|---|---|---|
| Data Entry | Enter each transaction by hand; prone to errors and duplicates | Automatic import from banks, accounting systems, and APIs; validation rules flag issues |
| Real-Time Visibility | Only as current as your last update; no instant alerts | Live or near-live updates; automated alerts for low balances or unusual activity |
| Forecasting | Manual projections based on spreadsheet formulas; limited scenario modeling | Machine learning models predict cash needs; scenario planning and stress testing built in |
| Scalability | Becomes inefficient as transaction volume or complexity grows | Handles high volumes, multiple entities, and multi-currency consolidation |
| Cost | Low upfront cost; high time investment and oversight | Software subscription or implementation cost; lower ongoing labor and fewer errors |
Manual tracking is acceptable if you have very few transactions, a single bank account, and predictable cash timing. A solo consultant with ten clients and monthly recurring expenses can manage a simple spreadsheet without much risk. But expect to spend more time maintaining it, and be ready to double-check your work regularly.
Automated tracking makes sense as soon as transaction volume grows, you add employees or suppliers, or you need faster visibility for decision-making. If you’re forecasting payroll, managing seasonal swings, juggling multiple accounts, or trying to improve collections timing, automation reduces manual effort and gives you the data you need to act quickly. Most growing businesses hit the point where manual tracking becomes unsustainable within the first year. When that happens, an automated dashboard saves time, cuts errors, and improves planning.
Essential Metrics for Tracking Cash Flow Effectively

A handful of core metrics give you the clearest picture of your cash position and help you spot problems early. Tracking these consistently turns raw transaction data into actionable insight.
Five critical metrics to monitor:
Cash inflows and outflows. Total money coming in and going out over a period (daily, weekly, monthly). Shows whether you’re cash-positive or cash-negative.
Actual cash position. Current balance across all accounts. This is the literal amount you can spend today.
Forecasted liquidity. Projected cash position based on expected inflows (customer payments, loan draws) and outflows (payroll, vendor bills). Helps you plan ahead.
Covenants and net debt metrics. For businesses with loans, tracking debt covenants and net debt (total debt minus cash) keeps you compliant and shows leverage.
Variance analysis. Difference between your forecast and actual results. Large variances signal timing issues, missed invoices, or unexpected expenses.
Days Sales Outstanding (DSO) and Days Payable Outstanding (DPO) add another layer. DSO measures how long it takes customers to pay you after you invoice them. Lower is better because you get cash faster. DPO measures how long you take to pay suppliers. Higher DPO means you hold cash longer, but delaying too much can damage supplier relationships. Monitoring both helps you optimize working capital: collect faster, pay strategically, and keep more cash on hand for operations.
Why do these KPIs matter? Because they turn vague concerns into specific targets. Instead of wondering “Do I have enough cash?” you can ask “Is my DSO rising above 45 days?” or “Did my actual outflows exceed forecast by more than 10 percent last week?” Clear metrics make it easier to set goals, track progress, and adjust your cash strategy before small issues become urgent problems.
Real-World Examples of Cash Flow Tracking Scenarios
Cash flow tracking shows its value in everyday situations where timing and visibility matter. Here are six practical scenarios where tracking makes a clear difference.
Daily sales deposits. A retail shop logs daily credit card settlements and cash deposits. By tracking these in real time, the owner knows exactly how much working capital is available to reorder inventory or cover a surprise repair without waiting for month-end statements.
Vendor payment scheduling. A small manufacturer tracks upcoming supplier invoices and schedules payments based on due dates and available cash. When a large equipment payment lands the same week as payroll, the system flags the overlap early enough to move cash from a reserve account or delay the equipment payment by a few days.
Payroll cycle management. A services company with biweekly payroll monitors cash inflows from client invoices. If a major client payment is late, the dashboard alerts the finance team in time to follow up on collections or arrange a short-term line of credit to cover payroll without bouncing checks.
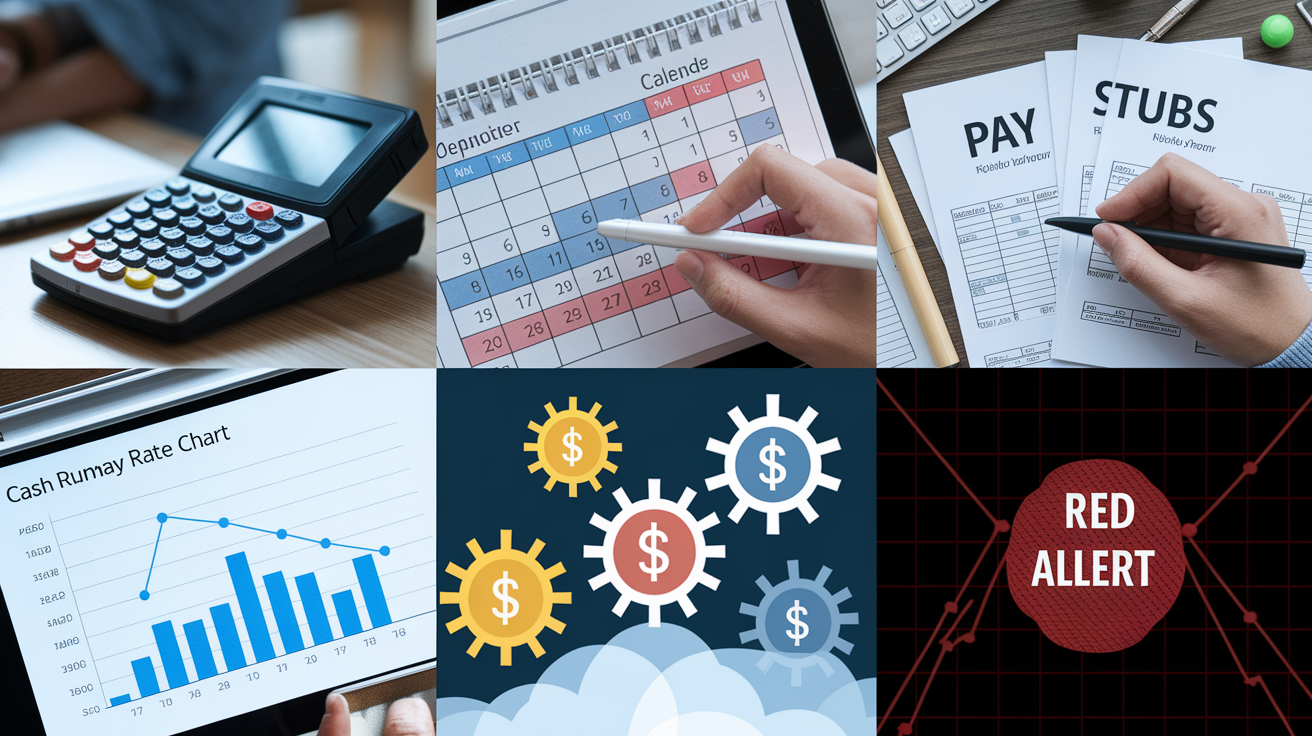
Cash runway calculation. A startup tracks monthly burn rate (total outflows minus inflows) and projects how many months of cash remain at the current spending pace. When runway drops below six months, the team knows it’s time to accelerate fundraising or cut discretionary expenses.
Seasonal cash flow planning. A landscaping business sees heavy revenue in spring and summer, then near-zero income in winter. By tracking historical patterns, the owner forecasts winter cash needs and sets aside reserves during peak months to cover payroll and overhead when revenue drops.
Anomaly detection and resolution. An e-commerce business uses automated tracking with machine learning. When an unusually large refund batch posts, the system flags it immediately. The team investigates, discovers a processing error, and resolves it 50 percent faster than manual review, preventing further losses.
These examples share a common outcome: tracking cash flow in real time or on a regular schedule gives you the information you need to act before problems escalate. In some cases, businesses report measurable results ($1.6 million in annual interest savings by optimizing payment timing, 95 percent or higher forecasting accuracy using automated models, and faster resolution times that prevent cash shortfalls). The specifics vary, but the principle holds. Visibility drives better decisions.
Tools and Dashboards Used for Cash Flow Tracking
A cash flow dashboard pulls transaction data into one place and displays it in a format that’s easy to read and act on. Core components include opening balance, total inflows, total outflows, and closing balance for a given period (daily, weekly, or monthly). Most dashboards also break down inflows and outflows by category (sales, payroll, rent, loan payments) and show trends over time so you can spot patterns or sudden changes.
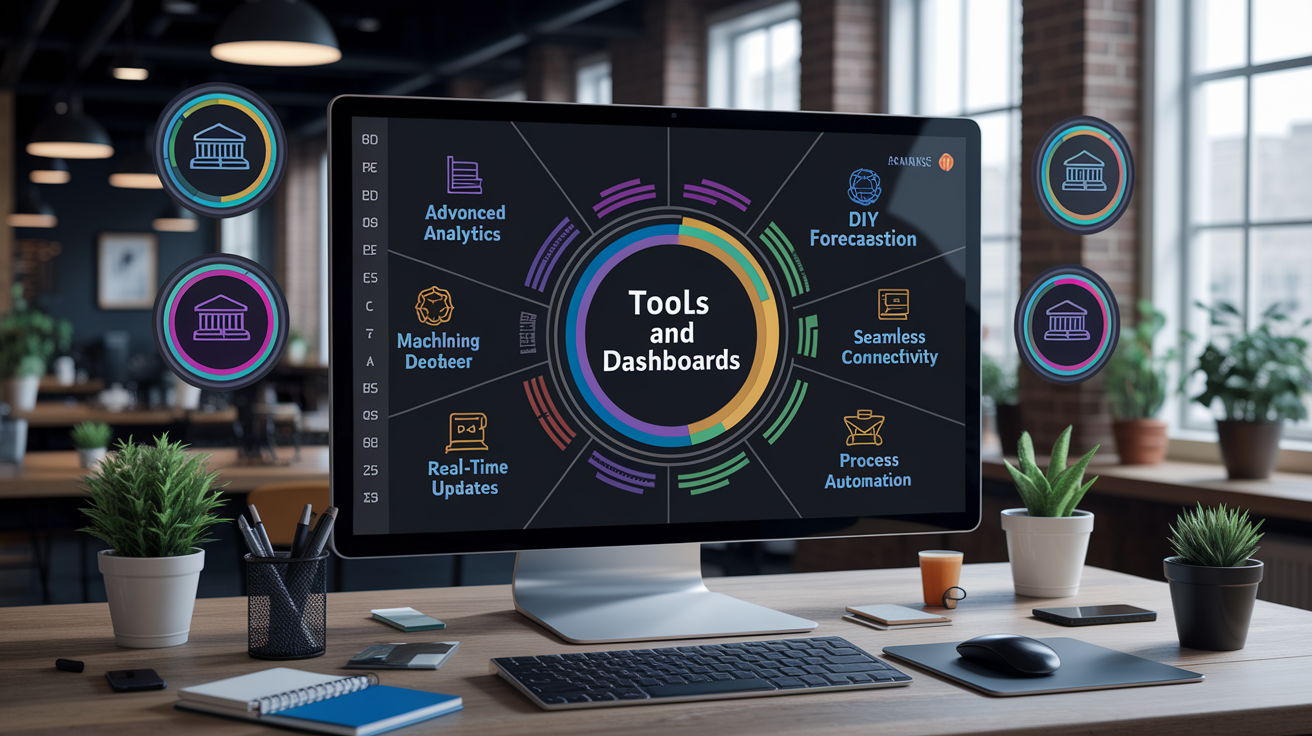
Dashboards designed for cash flow tracking typically include seven key features:
Advanced analytics and predictive modeling. Trend analysis, variance identification, and forecasting based on historical data.
User customization. Adjust charts, create calculated fields, and set up personalized alerts for metrics you care about most.
DIY forecasting and scenario modeling. Run what-if scenarios (What happens if sales drop 20 percent? What if a major customer pays 30 days late?) without rebuilding spreadsheets.
Machine learning engines. Automated anomaly detection, pattern recognition, and model selection from dozens or hundreds of algorithm options to improve accuracy.
Seamless connectivity and integration. Direct connections to banks, ERP systems (like SAP), invoicing platforms, and payment processors via APIs or file imports.
Real-time updates and automated alerts. Live or near-live data refresh; instant notifications when cash balance drops below a threshold or when unusual transactions post.
Process automation. Workflow automation for approvals, audit trails for compliance, and automated reconciliation against bank statements.
Visualization is critical. Raw transaction lists are hard to parse quickly, so dashboards use charts and summary cards to surface the most important information at a glance.
| Visualization Type | What It Shows | Best Use |
|---|---|---|
| Waterfall chart | Opening balance → inflows → outflows → closing balance, color-coded by category | See how each category (customer receipts, payroll, taxes) affects your cash position step by step |
| Line chart (12-month trend) | Operating cash flow, working capital, or burn rate over time | Spot seasonal patterns, growth trends, or sudden drops month over month |
| Forecast vs. Actual comparison | Side-by-side bars or lines showing what you expected versus what actually happened | Identify variance quickly and adjust future forecasts or spending plans |
| Heat map | Calendar or matrix view with color intensity showing cash flow by day or week | Highlight periods of high or low activity, useful for seasonal businesses or detecting irregular patterns |
Basic tools start with spreadsheets (Excel or Google Sheets) paired with automation platforms like Zapier or Make to pull in bank transactions or accounting data. Business intelligence tools like Tableau or Power BI offer more advanced visualization and direct connections to accounting systems. Enterprise setups use ETL pipelines and centralized data warehouses to consolidate data from multiple subsidiaries, currencies, and bank accounts into a single real-time view. The right tool depends on transaction volume, complexity, and how much automation you need, but the goal is always the same: turn raw data into clear, actionable insight.
Best Practices and Tips for Maintaining Accurate Cash Flow Tracking

Accuracy in cash flow tracking comes from consistent habits and reliable systems. The most common errors (duplicate entries, missed transactions, timing mismatches) happen when data is entered manually or when reconciliation is skipped. Building a few core practices into your routine prevents most problems before they distort your view.
Here are six best practices that keep cash flow tracking accurate and useful:
Reconcile weekly. Compare your tracking records against bank statements and accounting system balances every week. Catch errors while they’re fresh and easy to fix.
Automate data refresh. Set up daily or real-time data imports from banks and accounting software to minimize manual entry and timing delays.
Implement validation checks. Use automated rules to flag missing values, duplicates, outliers, or transactions that fall outside normal ranges.
Standardize data formatting. Use consistent currency formats, date formats (MM/DD/YYYY), and naming conventions so data aggregates cleanly without manual cleanup.
Set up alerts for critical thresholds. Trigger notifications when cash balance drops below a minimum level, when a large unexpected transaction posts, or when forecast variance exceeds a set percentage.
Enrich accounts receivable and payable data. Tag invoices and bills with customer names, due dates, and payment terms so you can predict per-account cash timing more accurately.
Common errors include double-counting a deposit because it appears in both your bank feed and your accounting journal, missing a scheduled payment because it wasn’t logged in your tracker, or using the wrong date (invoice date instead of payment date) and throwing off your timing analysis. Automation reduces these mistakes by pulling transaction data directly from the source and applying validation rules that catch inconsistencies before you act on the numbers.
Another frequent issue is failing to update forecasts after actuals come in. If you forecast $20,000 in customer payments this month but only $15,000 arrived, update the forecast for next month to reflect slower collections. Without adjustments, your projections drift further from reality, and you lose the early warning that cash flow tracking is meant to provide. Weekly reviews and automated variance alerts keep your forecast aligned with what’s actually happening.
When to Upgrade Your Cash Flow Tracking System
Manual tracking works until it doesn’t. The clearest sign it’s time to upgrade is when maintaining your spreadsheet takes more time than analyzing the data, or when you regularly discover errors after they’ve already caused a problem. If you find yourself entering the same transactions in multiple places, chasing down missing data, or waiting days for an accurate cash position, an automated system will save time and reduce stress.
Growing transaction volume is the most common trigger. A freelancer with five clients can manage a simple spreadsheet. A business with 50 customers, 20 vendors, three bank accounts, and weekly payroll needs something more robust. As complexity increases (adding employees, opening new locations, managing inventory, or juggling multiple currencies) manual tracking becomes unsustainable. Errors multiply, forecasts lag, and you lose the real-time visibility that lets you act quickly.
Five signals that it’s time to move to automated tracking:
High transaction volume. You’re logging dozens or hundreds of transactions every week, and manual entry is eating up hours.
Multiple bank accounts or entities. You need a consolidated view across accounts, subsidiaries, or currencies, and spreadsheets can’t keep up.
Forecasting needs. You want to run scenario models, stress tests, or predictive cash flow projections that go beyond simple formulas.
Integration requirements. Your accounting system, ERP, or bank offers API access, and you want data to flow automatically without manual exports and imports.
Compliance or audit demands. You need audit trails, automated reconciliation, and clear variance reports to meet investor, lender, or regulatory requirements.
Automated systems also make sense when you’re preparing for growth or fundraising. Investors and lenders expect accurate, up-to-date cash flow data, and a manual spreadsheet with formula errors or missing weeks signals weak financial controls. A real-time dashboard with integrated forecasts, variance analysis, and historical trends shows you have a handle on your finances and can scale without losing visibility. The upgrade pays for itself in saved time, fewer errors, and better decision-making.
Final Words
You’ve seen a clear definition of cash flow tracking, how inflows and outflows work, the common metrics and tools, and when to move from spreadsheets to automated dashboards.
Make it a habit: reconcile regularly, watch key KPIs, and pick a system that connects bank feeds to forecasts. Small steps cut errors and improve visibility.
If you still wonder what is cash flow tracking, it’s simply monitoring money moving in and out so you can plan for liquidity and avoid surprises. Start small and you’ll build real control.
FAQ
Q: What is a cash flow tracker?
A: A cash flow tracker is a tool or system for monitoring money moving into and out of your accounts, showing inflows, outflows, balances, and timing to help manage liquidity and forecasting.
Q: What is an example of a cash flow?
A: An example of a cash flow is a weekly customer payment that increases your bank balance (an inflow) or a monthly rent or payroll withdrawal that reduces it (an outflow).
Q: What are the 7 cash flow drivers?
A: The seven cash flow drivers are sales volume, price or margin, speed of collections (DSO), payment timing to suppliers (DPO), inventory levels, capital expenditures, and financing or debt activity.
Q: What are the four types of cash flows?
A: The four types of cash flows are operating activities, investing activities, financing activities, and the net change in cash and cash equivalents reported on the cash flow statement.